I’ve been (not very actively) looking for a monitoring solution for some time now. Yesterday I decided to check out a few good open source options, and stumbled on a Reddit post mentioning Grafana and Prometheus, so I decided to give it a shot.
Grafana is a metric visualization software. You feed it monitoring information and it can create some beautiful dashboards for you. Prometheus is a monitoring tool which utilizes its own query language (PromQL) to provide system metrics. By combining the two servers you can get some pretty nifty data visualizations.
Setting things up was pretty easy. Both Prometheus and Grafana had Apt repositories, so it was only really a matter of installing the servers, editing a couple config files, and logging into the web interface to build my dashboards. I hit a couple of snags due to some oddities with my own system, but the setup is pretty straightforward overall.
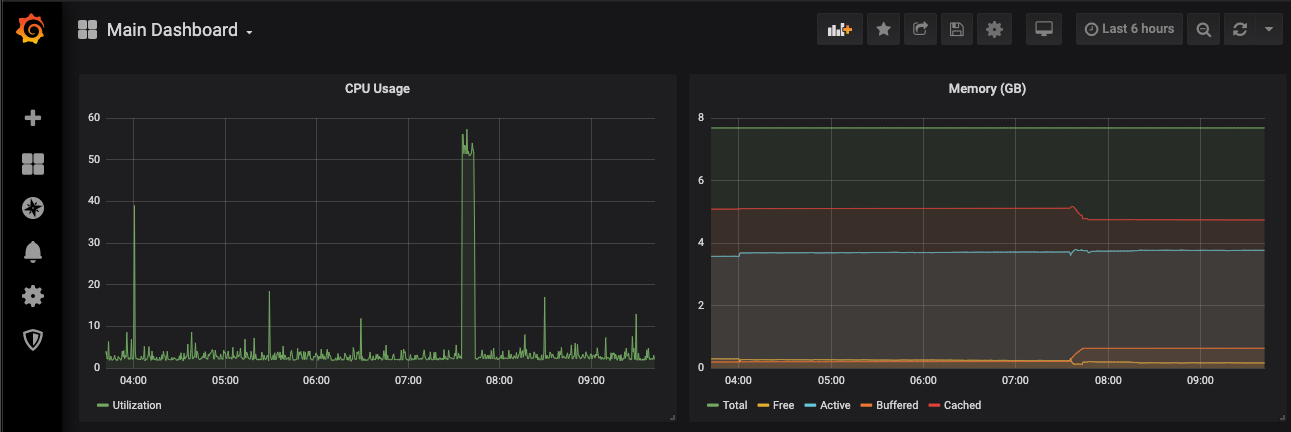
Once I had things up and running it was time to actually start monitoring. PromQL is an entirely new language and I couldn’t find particularly useful documentation, so I started off with only 2 displays: one for overall CPU utilization and one for memory.

I’d like to dig more into things down the line as Prometheus seems like a really powerful tool. Tracking HTTP requests seems pretty simple based on their documentation, and might be a cool thing to try.
I would definitely recommend using Grafana and Prometheus to someone looking for a free monitoring solution. It’s extremely customizable and you can get loads of information with Prometheus. The only issue is that it’s a bit of a pain to configure, and if you’re looking for something a bit more plug-and-play, this might not be the solution for you.
